Mr. Abhishek Dubey, Head - Strategic Business Development Unit
Abhishek Dubey is the Head of Strategic Business Development Unit and part of NJ since last 10 years. Abhishek has played a key role in building the policy, process & system structures at NJ. He is the Chief Policy & Communications officer and also responsible for publications and the front-end - websites & on-line desks at NJ.
MARS is fast emerging as an effective, ready solution for addressing investor's needs when it comes to managing asset allocation and creating a suitable portfolio of quality mutual fund schemes. We at NJ believe that MARS simplifies a lot of things for the Partners and helps make business scalable while ensuring that quality, automated portfolio management is done for participating investors. MARS is slowing assuming significance as a necessary element for successful, scalable business practice focussed on client's best interests.
With raising popularity of MARS, it is obvious that the investors what to know what kind of gains/losses and returns they have made from the MARS investments. However, this is something which, as per our observations, is not effectively communicated by our Partners, even though the necessary information is already available at the Partner's disposal. Since, this question assumes great significance and needs to be answered, we have decided to dig deep into the issue and explain in detail to the Partners how the actual performance of MARS portfolios can be see and understood from the existing report. Having familiarity with the report will help Partners be more confident in answering their investor queries appropriately and also for promoting MARS to other investors.
In Brief:
Consider how the investment behaviour in any particular MARS portfolio over a period of time. An Investor would have invested into MARS Portfolio(s), after that he would have done multiple time top-ups(Additional Investments) and redemption (Partial) from the portfolio. Further, in-between he would have done portfolio re-balancing also. At the end of it all, the investors want to know the actual returns they have made from the date they have started investing into the MARS Portfolio(s).
Now, in such kind of investment scenarios, the MARS Valuation Report would not give the answers that the investor asks to us. For the right answer, we need to look at the “MARS Performance Report” which helps us know the actual performance of MARS Investments, as was our question.
MARS Performance Report:
- This report provides Performance of your investments in MARS Portfolio(s).
- Annualized return is a fair way to judge investments when you have multiple time investments and redemption flow from a single portfolio. The same is the case with your investments in MARS Portfolio(s) and hence to measure the performance of MARS investments this report uses Internal Rate of Return (XIRR) method.
- Here, in this report you get TWO different ways to look at how your investments has performed. These TWO report types suffice the need to look into the performance of your investments from 2 different perspective that is: Period Specific and As On Date. Let's understand it.
Detailed understanding of Period Specific report type
# Why “Period Specific” Report Type?
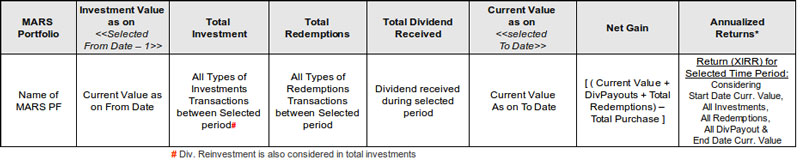
If you want to get a return of your MARS Investments for a particular time frame, especially from the start of your first investment then you can use Periodic report format. This report type considers the Investments (fresh, top-up), Redemptions (partial redemption, full redemptions) & Dividend received between the selected from date & to date.
PURCHASE: It takes into consideration all Purchase Transactions: First time + Additional (Top-Up)
- Investments done by cheque mode
- Investments done by Security / Unit Transfer mode
- Switch-In (in case of Portfolio Switch)
- All other types of cash flow which comes into the MARS Portfolio.
- Div. Re-investment Transactions also considered as purchase
REDEMPTION: It takes into consideration all the Redemption Transactions: Partial + Full Redemptions.
- Normal redemptions from E-Wealth (from scheme(s) belongs to MARS Portfolio)
- Un-mapping of MARS Portfolio from the client.
- Switch-out (in case of Portfolio Switch)
- All other types of cash flow which goes out of MARS Portfolio.
DIVIDEND:
- Dividend Re-Investment: It takes into consideration of all the Dividend Re-investment in the Portfolio. Currently Div. re-investment amount gets added into to Total Purchase Amount.
- Dividend Received: It takes into consideration of all the Dividend received from the Portfolio.
Note: MARS Performance calculation does not consider re-balance transactions. i.e. whatever purchase or redemption takes place on authorization of the MARS Re-Balance orders are not taken into consideration while calculating the MARS Performance. The reason for this is that any rebalancing, if done, is only internal within the portfolio which does not result into any cash-flow transaction and thus does not impact the XIRR for the portfolio.
# Process
Follow 4 steps simple process and get performance of investments in MARS Portfolio(s).
Step 1: Login to Client Desk and access MARS Performance Report.
Path: Client Desk > MARS > MARS Performance Report
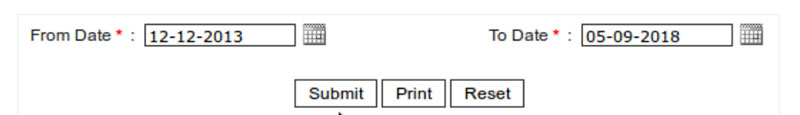
Step 2: Select the Period Specific report type from filters.
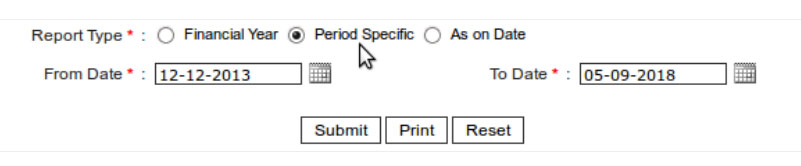
Step 3: Enter 12-12-2013 as a FROM DATE and Current Date as TO DATE.
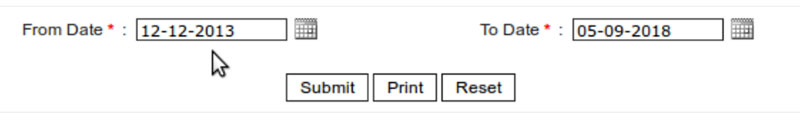
(Note: 12-12-2013 is choosen as its a start date of MARS and you may not know the exact date of your investments into MARS.)
Step 4: Click the Submit button to get a report.
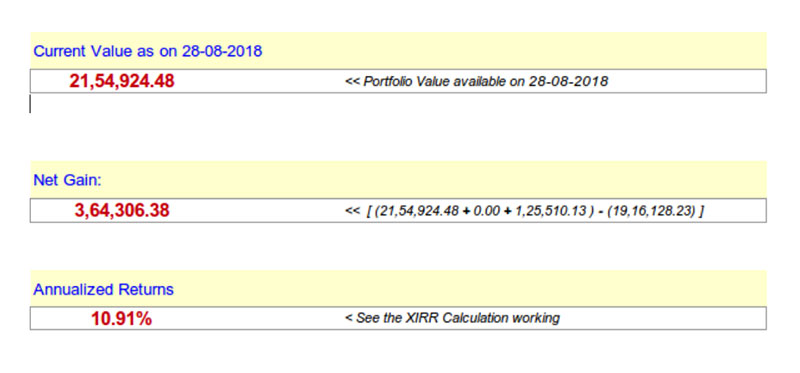
# Working of Period Specific Format
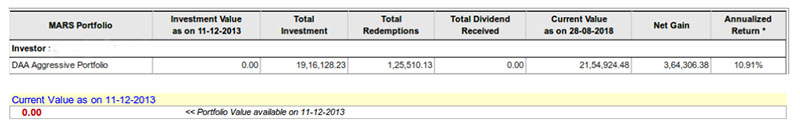
Sample Case:
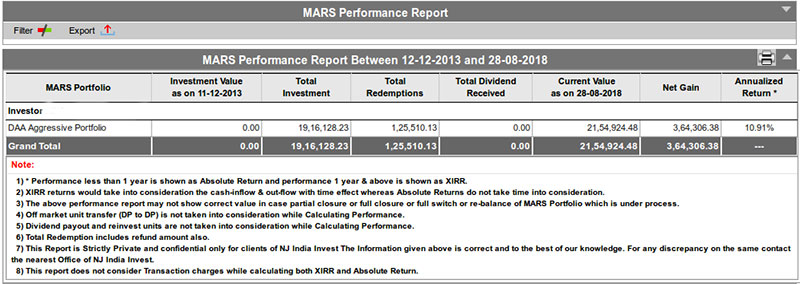
(Note: Figures in above image are indicative in nature and may not represent the actual performance /case history)
Working:
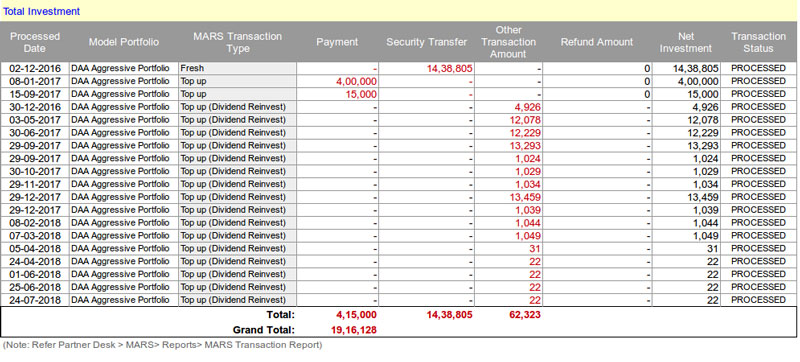
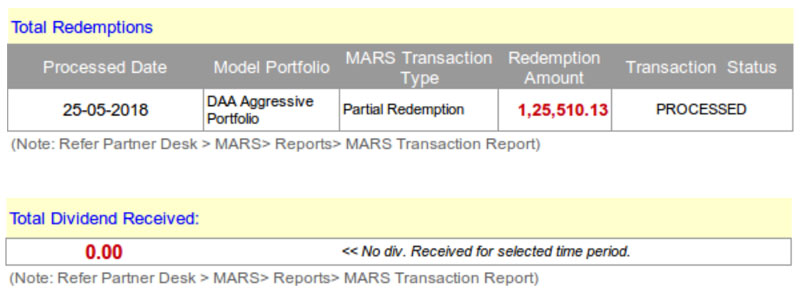
# Explanation with Transactions
Sample Case:
# Working of XIRR
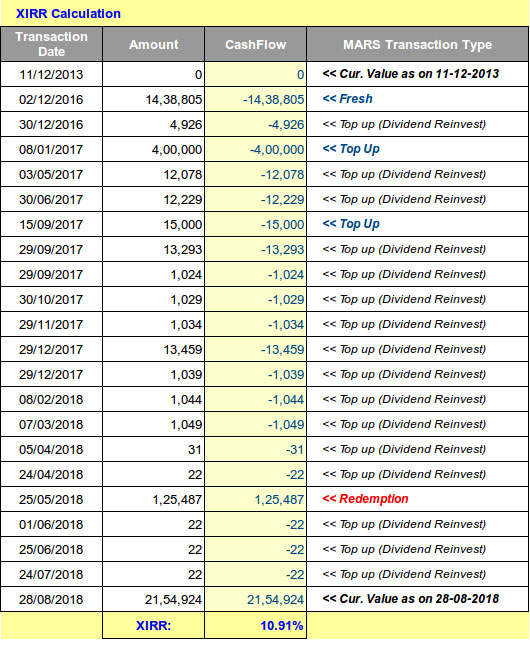
(Note: You can access all types of MARS transactions from Partner Desk > MARS > Reports > MARS Transaction Report)
Brief on Financial Year Wise report type
The Financial Year wise report working is a same as Period specific. The only differences is of from date and to date. Here, in this report type a from date always be the 01 April for selected FY and To date always be the 31st March of the selected date. (Note: In case selected FY is not completed then “current date” will be considered as a TO DATE.)
Brief on As on Date report type
# Sample Case:
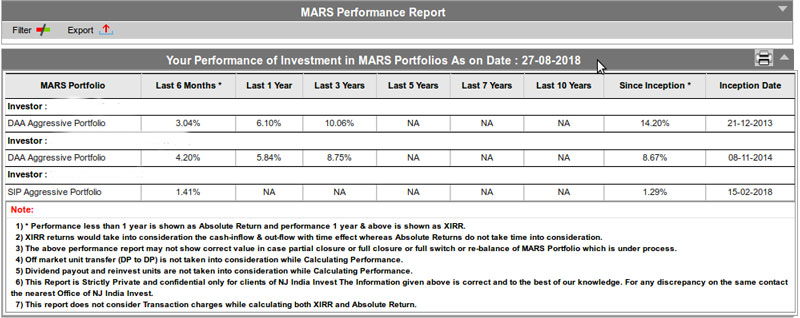
(Note: Figures in above image are indicative in nature and may not represent the actual performance /case history)
# Format Explanation:
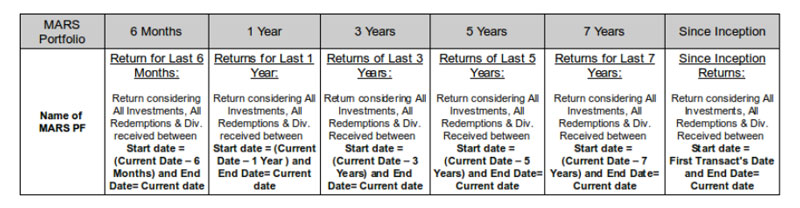
- The As on Date report uses the same calculation logic for performance as explained earlier. The difference is in the format wherein we have specified different From_ To_ periods (6 months /1 year / 3 years and so on) instead of asking for custom period selection.
- This is the most commonly used report type you come across to get the return of any Mutual Fund Scheme.
- User should refer to this report type to understand and to take a glance at performance between different time periods in a single view.